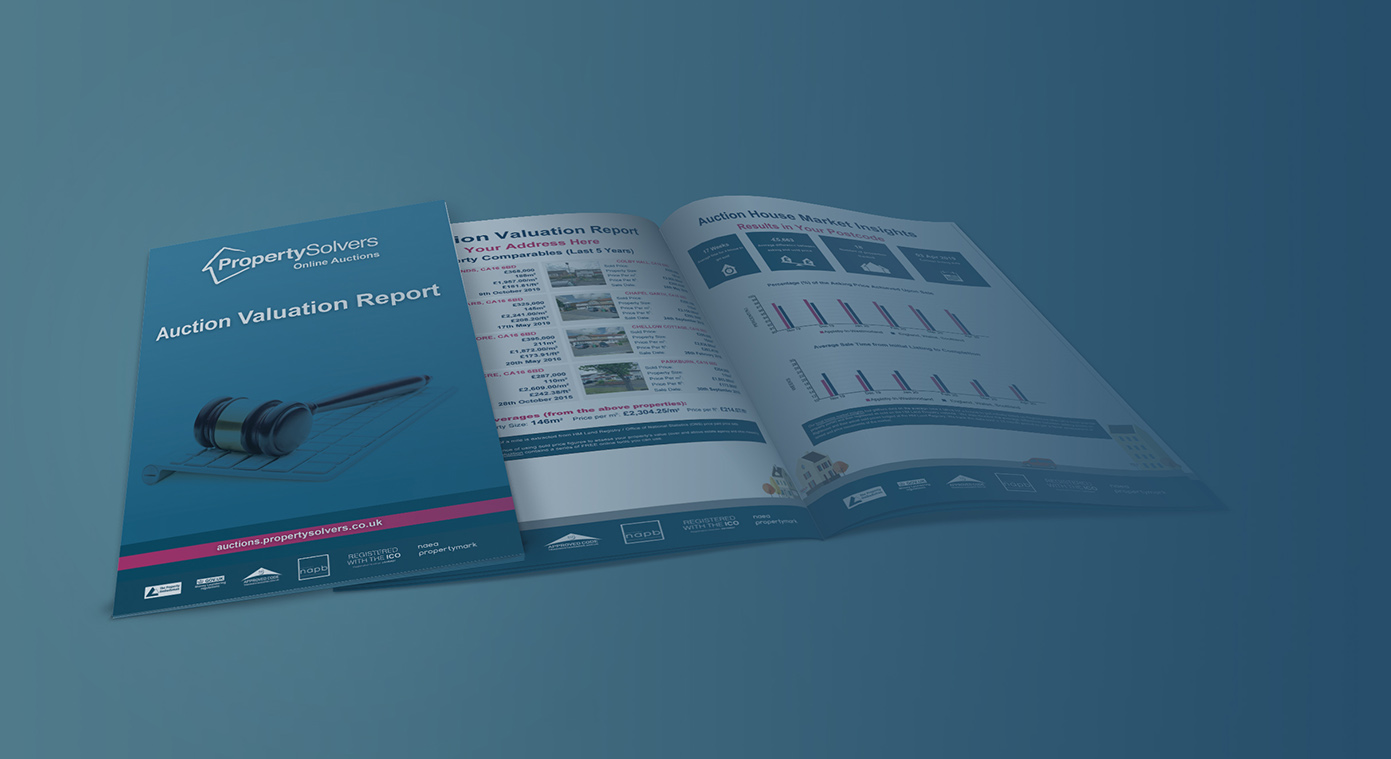
What's Included?
-
Summary Information + Suggested Auction Guide Price
Breakdown of the last recorded sales price, estimated current open market value, equity level, price per m2/ ft2), Energy Performance Certificate rating. Assuming we have enough information, we will also provide a suggested guide price (although we would usually require a conversation in order to provide a more accurate figure).
-
Comparable House Sale Data
Comparable properties within 1/4 a mile using HM Land Registry / Office of National Statistics (ONS) price paid price data – providing an excellent gauge for us to discuss the optimum auction valuation points.
-
Local House Market Insights
Essential data on the percentage asking price achieved upon sale / average sale time from initial listing to completion (extracted from our speed of sale and asking vs. sold price tools) + historical data. With sale auction sale completion times between 50 and 75% faster, you can see how we compare.
-
Property Price Trends
House price trends at a county/regional level (i.e. yours and surrounding postcodes grouped together). Excellent insights into pricing for the best outcome at auction.
-
Property Prices in Your Postcode
Average prices of all residential properties sold over the most recently-tracked 12-month period in your postcode.
-
Property Types in Your Area
Proportional split of different types of residential properties in your postcode (detached, semi-detached, terraced houses and flats).
-
Sold Prices of Property Types
Check the sold prices flats, detached, semi-detached and terraced properties in your postcode over the last quarter. This is crucial data to apply to our auction reserve and guide prices.
-
House Price Bracket
The percentage of sales within various price brackets of your property type over the last 12 months in your postcode.
-
Prices of Nearby Properties Similar to Yours
The average prices of properties of your type with the same number of bedrooms over the last 12 months in your postcode. Another important detail to consider when valuing properties for auction.
-
Freehold / Leasehold Local Property Prices
With the prices for leasehold and freehold properties can vary significantly, it’s worth looking closely at the local trends (regardless of whether you sell via an estate agency, at auction or privately).
-
New Property Instructions in Your Local Market (Over the Last 12 Months)
These are the properties that have estate agents have listed for sale in your local area (this does not mean that the properties are sold).
-
Number of Sales Marked as Sold STC or Under Offer (Over the Last 12 Months)
Data showing sales agreed by local estate agents (changed to Under Offer or Sold STC).
-
Number of Properties That Have Had Price Reductions (Over the Last 12 Months)
A good sign of the buoyancy of your local house market, the lesser the number of price reductions is typically a positive sign.
-
Table of Recent Sales Close to You
A whole page showing some of the recent sales in your postcode – including differences between initial (asking) price and sold prices as well as the number of days to sell.
-
Most and Least Expensive Streets
The most and least expensive streets in your postcode over the last 5 years – including the approximate distance from your street.

